Transform complex data into professional Tableau dashboards with actionable insights. We specialize in VizQL performance tuning and LOD Expressions for enterprise-scale Sales, HR, and Finance analytics.
Managing large-scale visual analytics requires technical depth beyond basic charting. Explore our latest results to see how we follow Tableau best practices to ensure your reports remain fast, scalable, and intuitive.
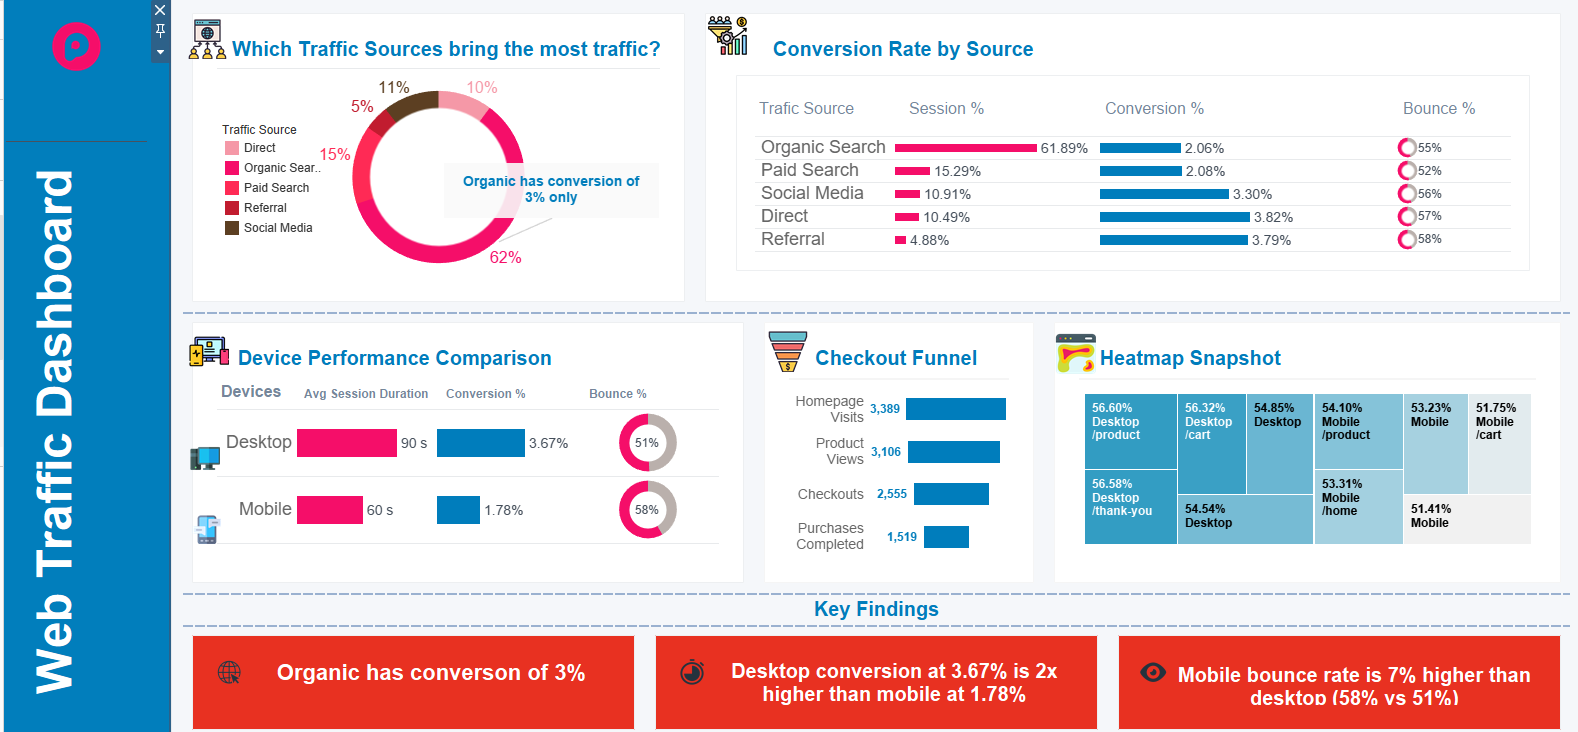
We design "Data Stories" using Tableau’s drill-down logic and parameters, enabling executives to navigate from high-level summaries to individual rows in one click.
If your workbooks are slow, we optimize LOD expressions (Fixed, Include, Exclude) and data extracts to maximize the speed of the VizQL engine.
We manage your Tableau Server or Tableau Cloud environment, configuring secure user permissions, refresh schedules, and data governance.
A proven development process designed to deliver accurate insights on time.
Fill out our quick intake form to detail your data sources, platforms, and the specific KPIs you need to track.
We review your requirements and reply within 24 hours with a clear delivery timeline, technical approach, and pricing.
You receive your first functional draft quickly. We iterate on your feedback until the dashboard is pixel-perfect.
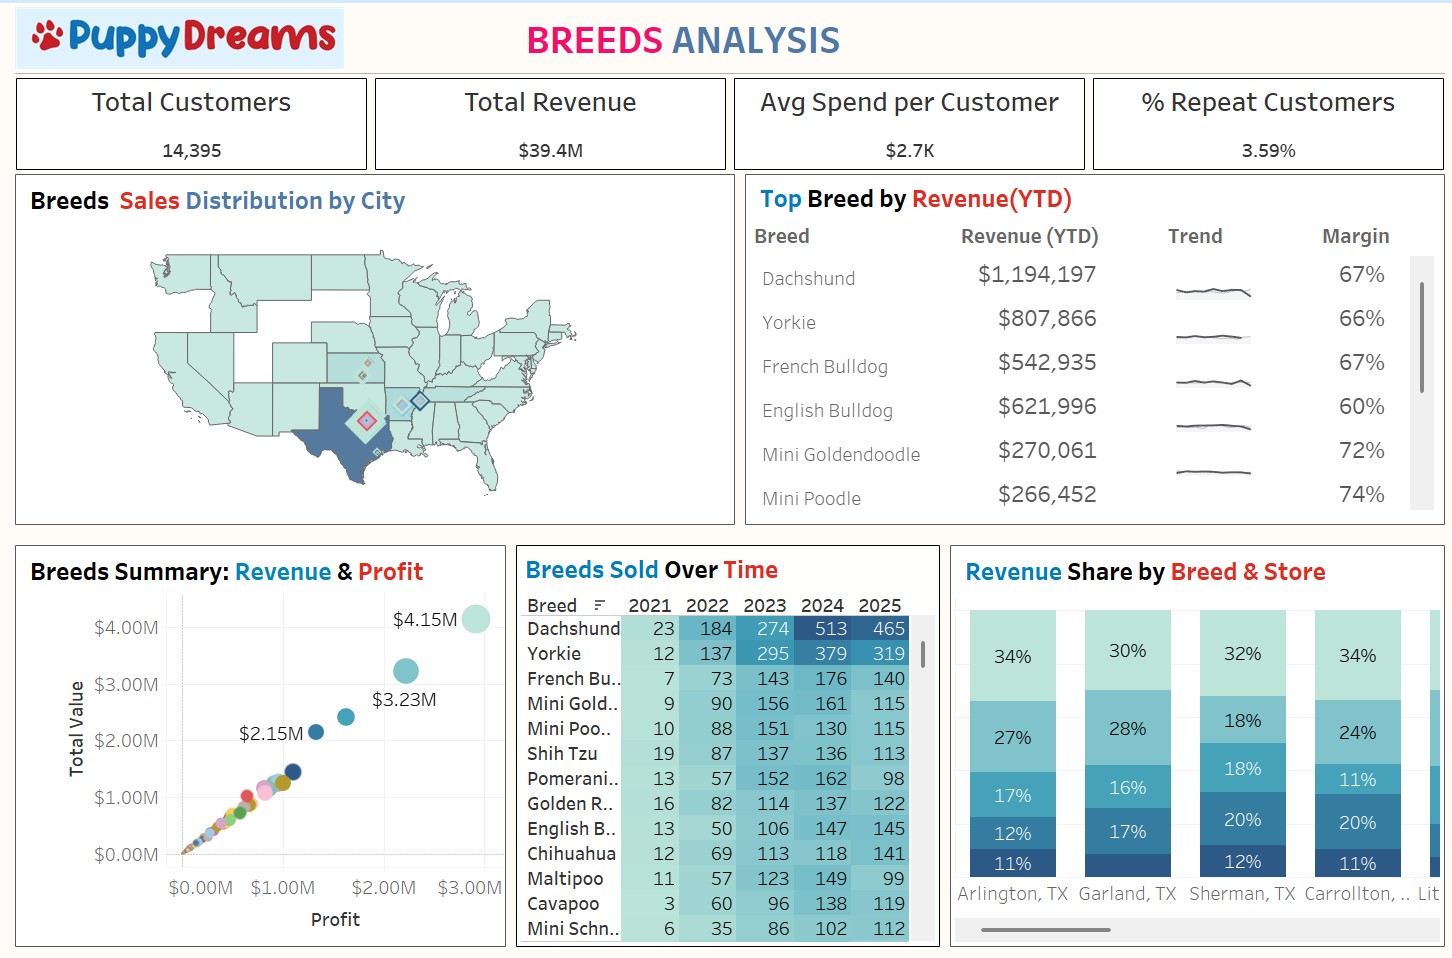
Sales Performance & Revenue Tracking
Built for a B2B SaaS company.
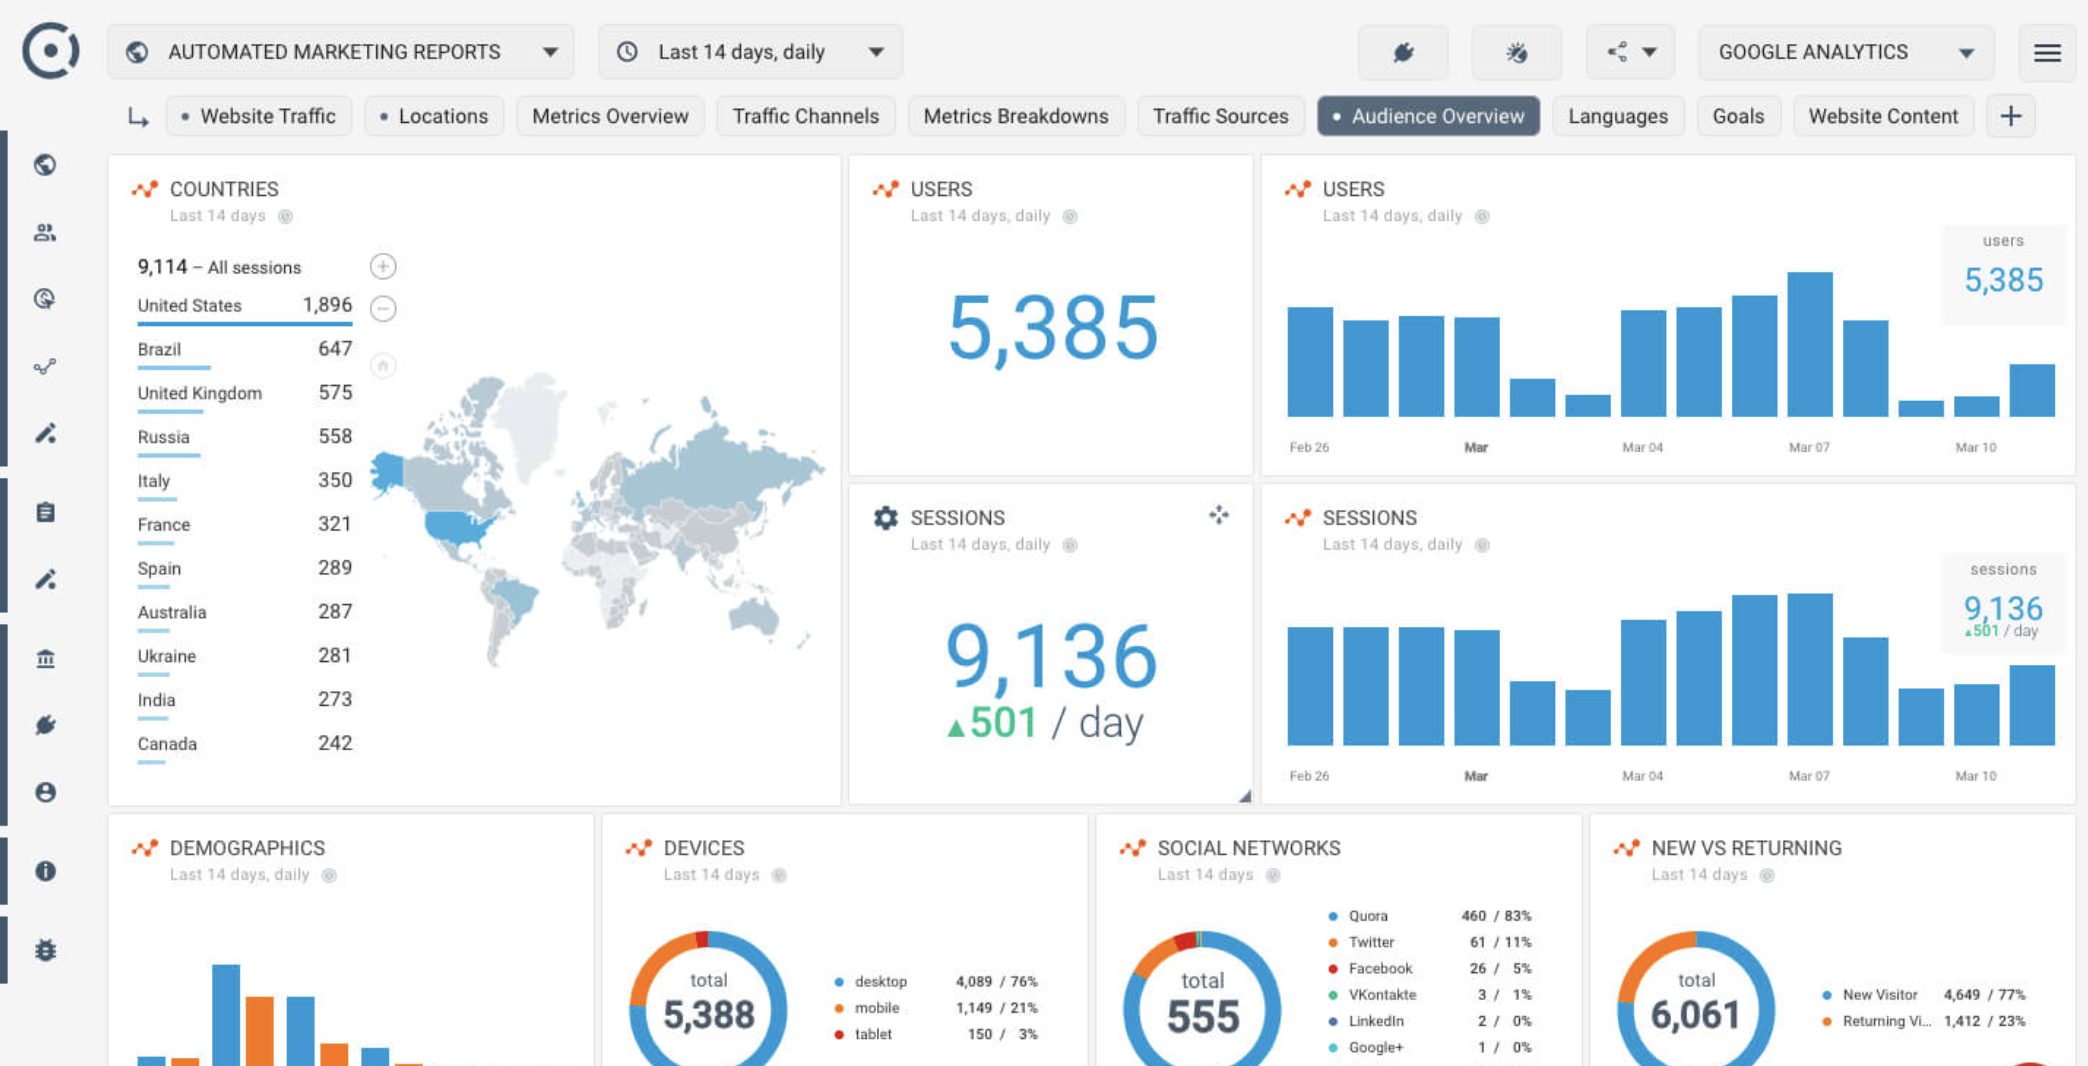
Automated MRR, Churn, and pipeline tracking across 3 regions.
HR Analytics & Workforce Management
Built for a 500+ employee enterprise.
Consolidated attrition and diversity metrics into a single executive view.
Tableau excels at visual storytelling and pixel-perfect custom charts. Power BI is better for Microsoft-stack organizations needing tight Office 365 integration and cost-effective licensing. Both support enterprise-scale deployments.
Depending on data complexity, a production-grade dashboard typically takes 1 to 2 weeks. This includes data cleaning, UI/UX design, and cross-platform testing.
Yes, Tableau has native connectors for SQL Server, Snowflake, BigQuery, and Salesforce. For live data connections to unsupported platforms, see our API Integration services.
Level of Detail (LOD) Expressions allow us to calculate values at specific granularities independent of the visualization context. This is essential for accurate cohort analysis and complex variance reporting.
Yes. We can seamlessly migrate on-premise workbooks to Tableau Cloud, ensuring user permissions, data source connections, and automated refresh schedules are preserved.
We never build dashboards on messy data. We use Tableau Prep, custom Python scripts, or automated SQL pipelines to structure and normalize your data into clean, "analytics-ready" tables first.
View our analytics packages or request a technical audit below.
Discuss your visual analytics project with a certified expert. We reply within one business day.
Explore related dashboard and automation services.
We work remotely with clients across the US, UK, Canada, and Australia.