Custom KPI Dashboard Development
We design role-specific scorecards for Marketing, Sales, Finance & Ops. Stop guessing and start driving decisions with real-time data.
Dashboards Tailored to Your Department
We don't just build charts; we build business solutions. Every department needs to look at data differently to drive performance.
Executive Dashboard for Business
Give leadership a 10,000-foot view of the company. We consolidate cross-departmental data into a single, highly-governed scorecard that tracks top-line revenue, blended margin, and overall health without getting lost in the weeds.
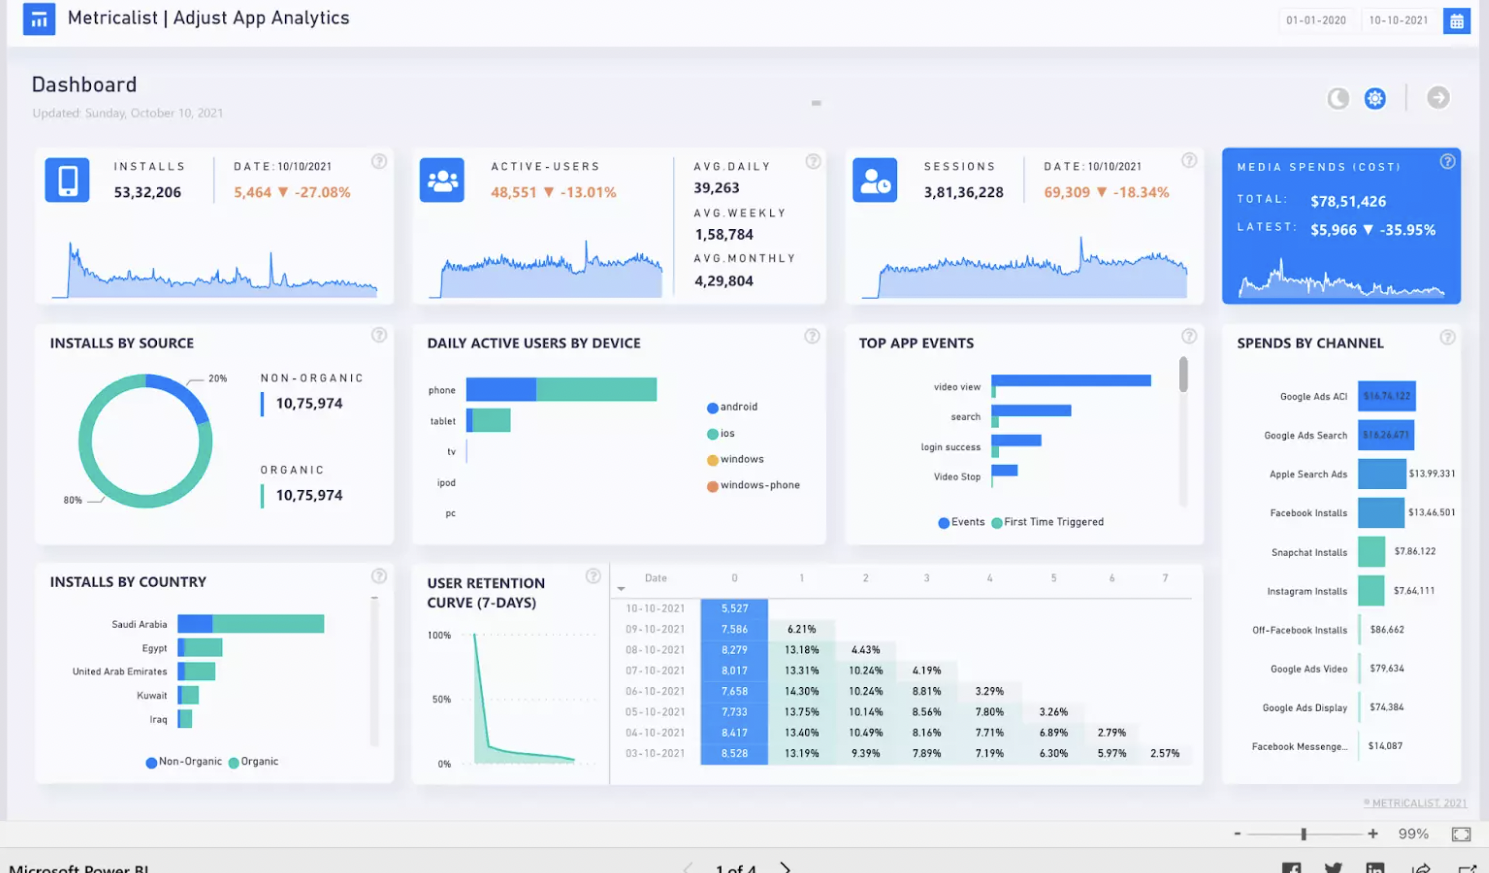
Marketing Analytics Dashboard
Stop guessing which ads work. We blend Google Ads, Meta Ads, GA4, and CRM data to calculate true blended ROAS and Customer Acquisition Cost (CAC), allowing marketing teams to confidently scale winning campaigns.
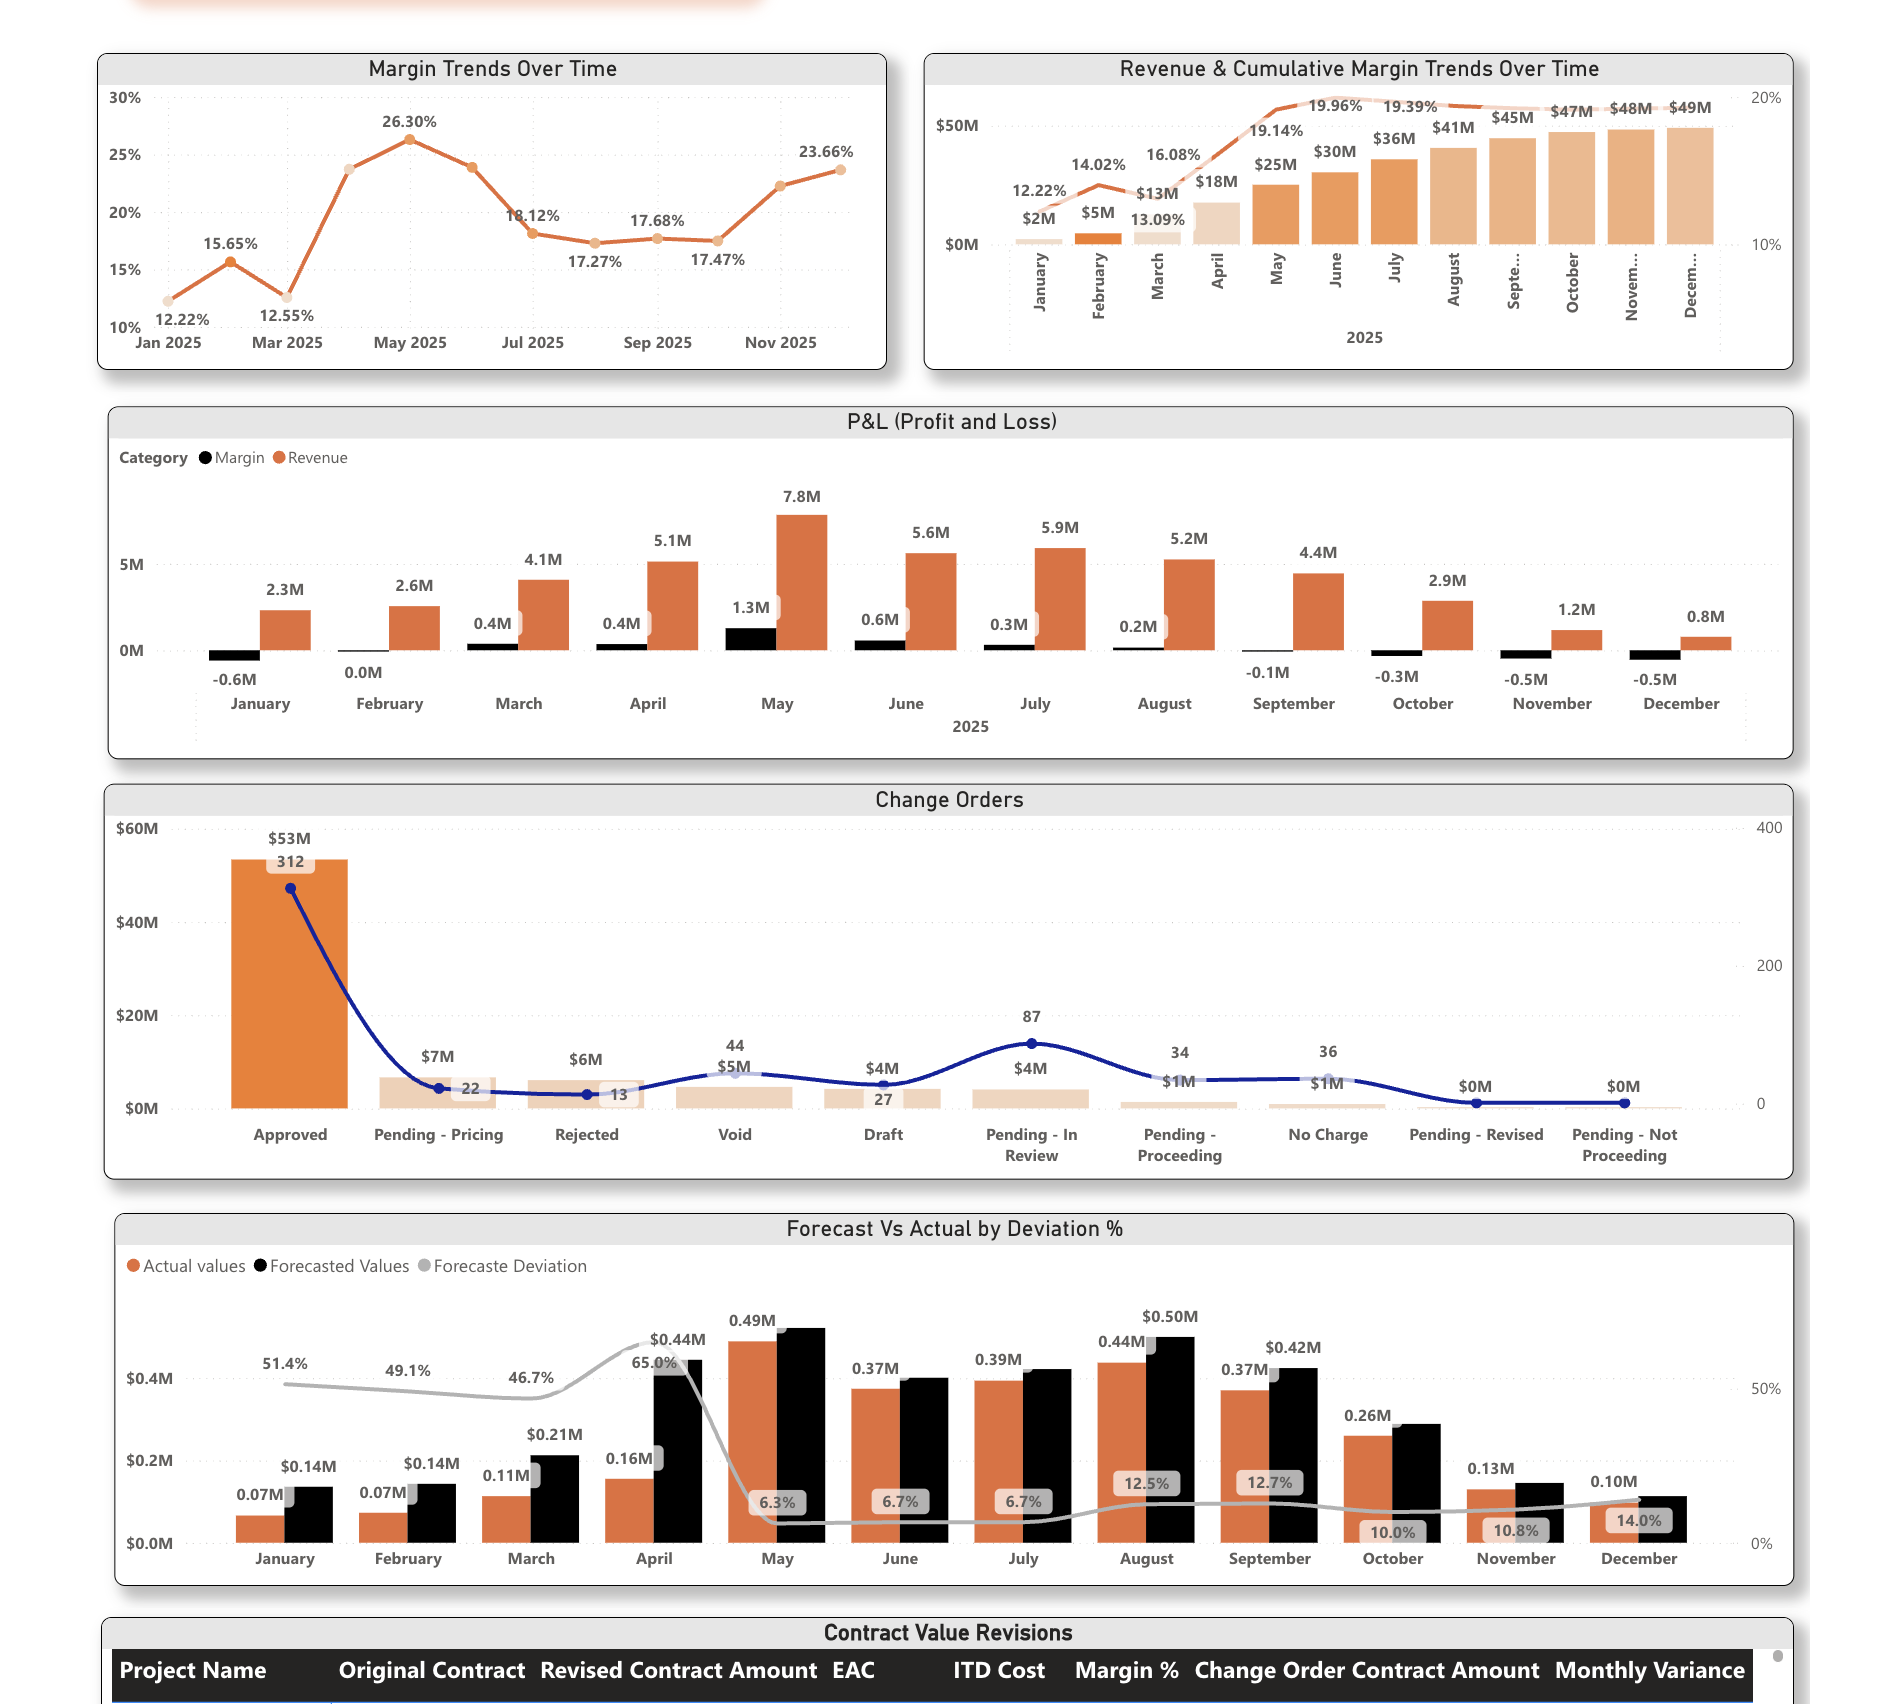
Finance Dashboard Development
Automate end-of-month reporting. We build rigorous financial models tracking P&L, cash flow runway, Budget vs. Actuals (BvA), and working capital, complete with Row-Level Security (RLS) to keep sensitive numbers safe.
Sales Pipeline Dashboard
Connect directly to Salesforce or HubSpot. We visualize pipeline velocity, rep quota attainment, and historical win/loss rates so sales directors can identify bottlenecks and forecast revenue accurately.
What KPIs should a marketing dashboard track?
A marketing dashboard should track GA4 sessions, paid media ROAS by channel, SEO keyword rankings, campaign conversion rates, and cost per acquisition (CPA) across Google and Meta Ads.
What should an executive dashboard include?
An executive dashboard for business should include top-level metrics across all departments: Total Revenue vs. Target, Gross Margin, overall Customer Acquisition Cost (CAC), Net Promoter Score (NPS), and current Cash Runway. It should be easily scannable on mobile devices for leadership on the go.
"The executive dashboard they built gave our leadership team complete visibility into our marketing and sales pipelines. It replaced 4 different spreadsheet reports and saves us hours every week."
VP of Operations, Enterprise SaaS
Sample Work
A peek at custom KPI dashboard layouts across departments.
Regional Sales Pipeline
Built with automated Salesforce integration
HR & Workforce Analytics
Built with Row-Level Security for privacy
Need a faster starting point?
We offer accelerated dashboard builds adapted from proven, industry-standard templates to get you to insights faster.
Supported Data & Visualization Stack
Dashboard Development FAQs
What do you build in each tool? ⌄
Power BI for enterprise governance and Microsoft stacks, Tableau for deep visual storytelling, and Looker Studio for quick marketing and Google ecosystem reporting.
How do you keep dashboards fast? ⌄
We focus on robust data modeling at the warehouse level. We use aggregations, data extracts, incremental refreshing, and lean semantic layers tuned specifically for the tool's engine (like VertiPaq or VizQL).
Can we embed these dashboards into our own portal? ⌄
Yes. We regularly set up Power BI Embedded, Tableau Embedded, and Looker Studio secure embeds so your clients or internal teams can view the analytics directly inside your existing software.
Do you provide team training? ⌄
Yes, every project concludes with a clean handover. We provide admin documentation, end-user playbooks, and live training sessions to ensure high adoption rates across your team.
Get in touch
Tell us about your data needs. We’ll reply within one business day.