AI is everywhere — but you can't tell what's useful
Everyone says “use AI” — but for what? You need someone who's actually shipped agents, not just demoed them in slides.
→ We've shipped 50+ in production
DATA · AUTOMATION · AI · DASHBOARDS
Dashboards, data pipelines, automations, and AI agents — built and wired together so your team stops switching tabs and starts shipping decisions.

THE STACK WE BUILD ON
We pick the right tool for the problem — not the other way around.
Where businesses get stuck
If one of these sounds like your team, you're in the right place.
Everyone says “use AI” — but for what? You need someone who's actually shipped agents, not just demoed them in slides.
Customers ask on WhatsApp, Instagram, your website — at midnight. By morning they've bought from your competitor.
→ We build AI agents that reply 24/7Internal dashboards. Customer portals. Booking apps. Quote builders. You know what you need — you just don't have a dev team.
Shopify, HubSpot, Google Ads, QuickBooks — none of them talk to each other. Nobody has the full picture.
Copy-paste from one system to another. Re-typing the same numbers. Hours lost to work a script could do in seconds.
Your team rebuilds the same Excel report every Monday. By Wednesday, the numbers are already stale.
Three teams, three versions of revenue. Every meeting starts with “whose number is right?” instead of what to do.
You know the answer is in the data somewhere — but pulling it takes a week, so you decide without it.
Four capabilities, wired to work as one system — not four tools fighting each other.
Pillar 01
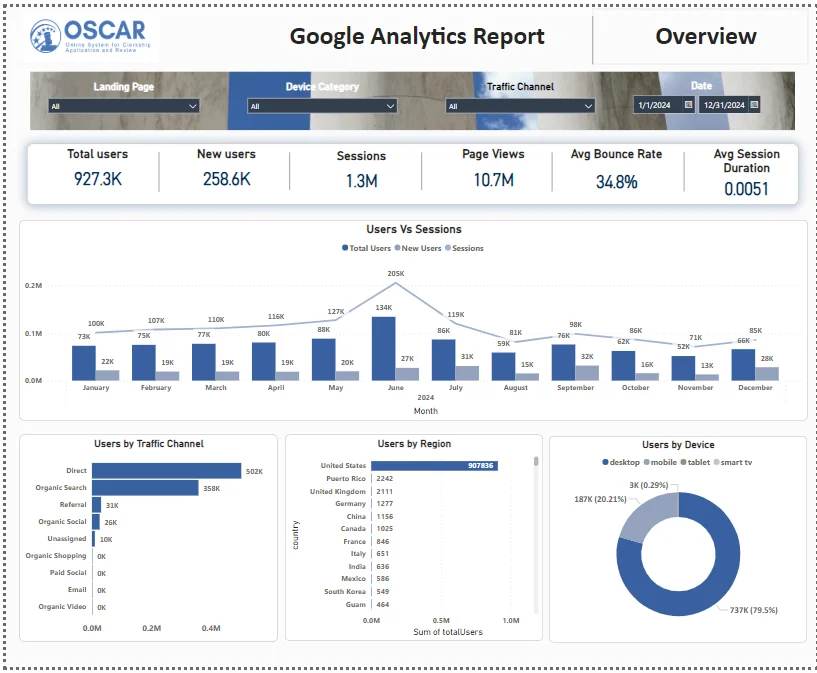
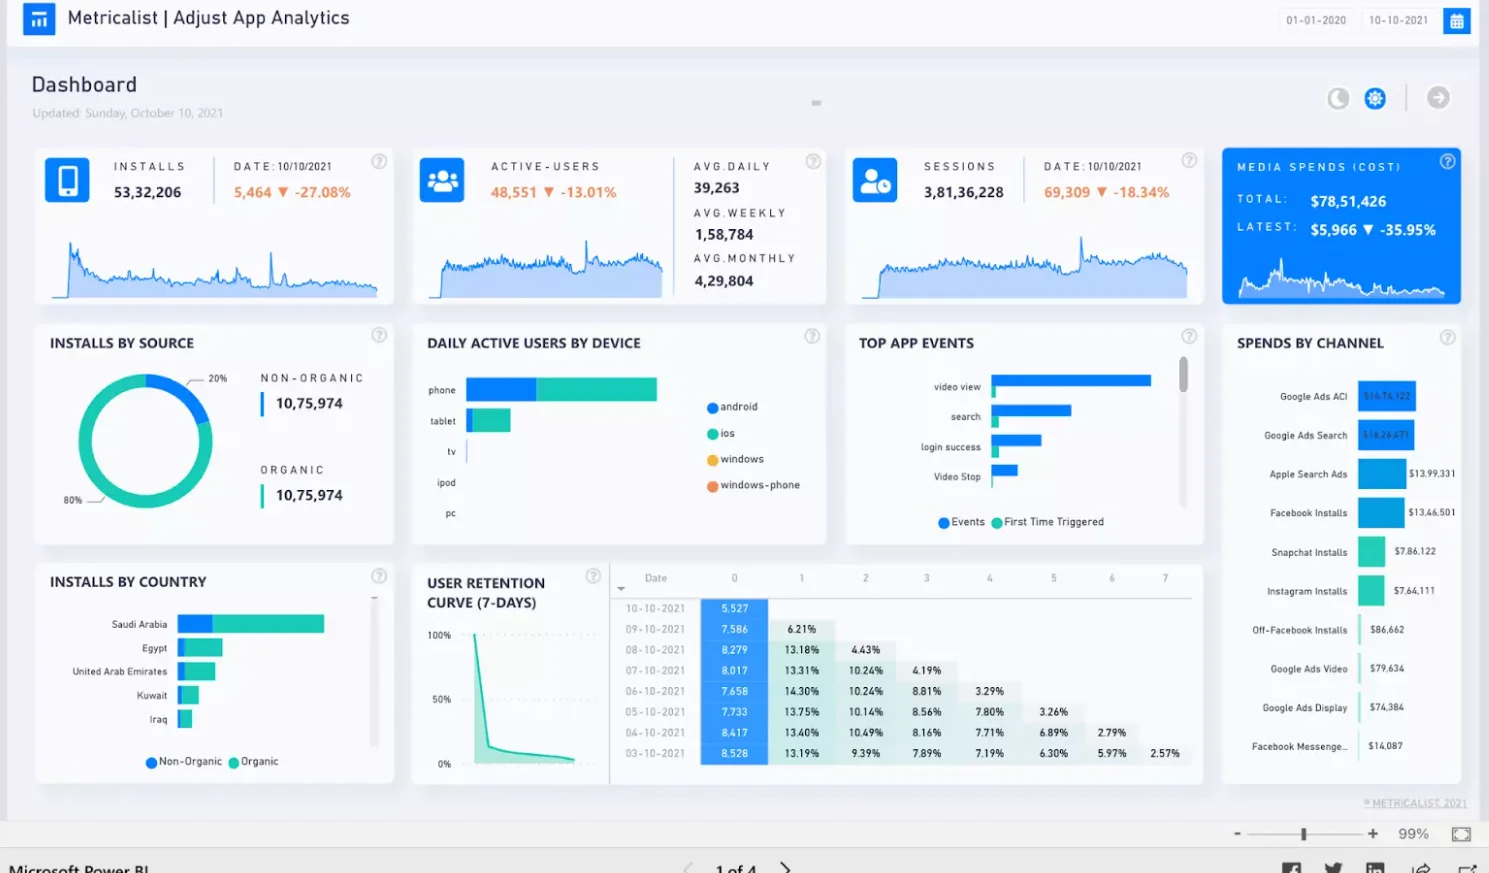
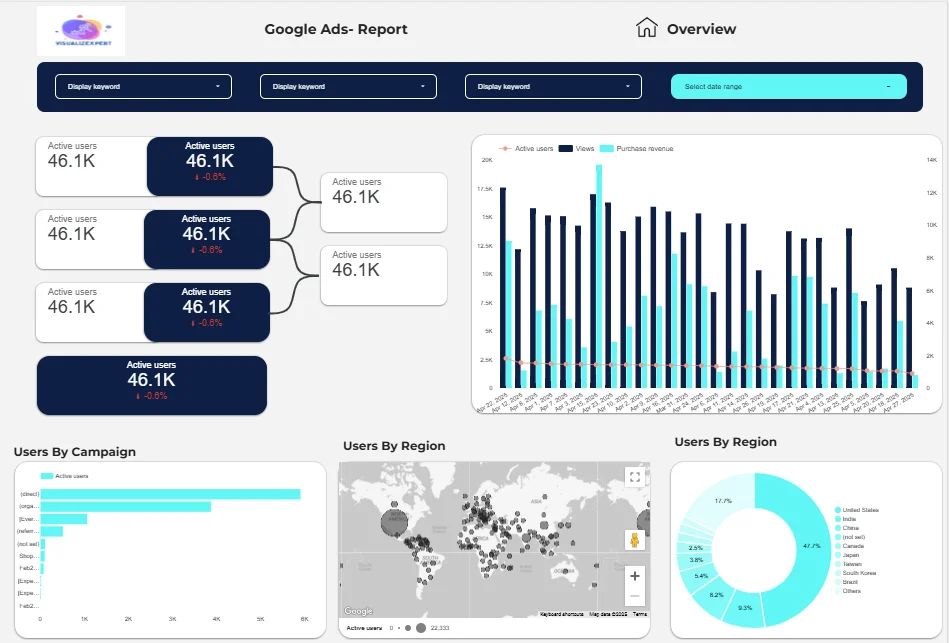
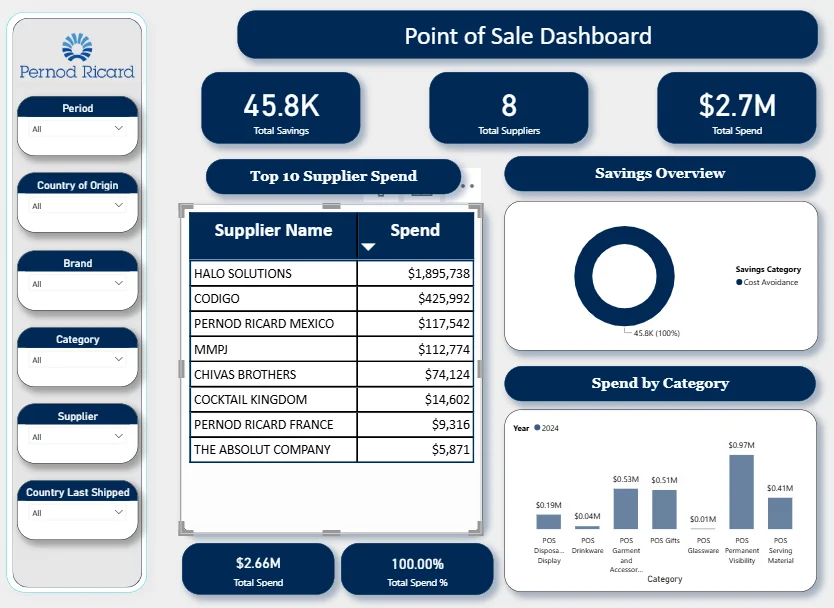
Power BI, Tableau, and Looker Studio dashboards wired directly to Shopify, Amazon SP-API, Guesty, HubSpot, or your warehouse. Track LTV, CAC, RevPAR, and contribution margin in real time — not last week's screenshot.
Executive-ready dashboards in 7–14 days.
Pillar 02
Scalable BigQuery, Supabase, and ClickHouse pipelines. Custom Python ETL, scheduled refresh, DAX and Power Query optimization. Clean, validated data your BI tools can actually trust.
One source of truth instead of ten dashboards.
Pillar 03
Self-hosted n8n and Make.com workflows that don't break at 2 AM. Custom API + webhook integrations to sync inventory, automate payroll, unify your GTM stack — built to scale, not just demo.
15+ hours per week back to your team.
Pillar 04
Production AI agents on WhatsApp, Telegram, and web — powered by Claude, GPT-4, and Gemini. Lead qualification, PDF data extraction, vision-enabled product search, 24/7 concierge. Live in production, not slideware.
24/7 sales and support that scales without headcount.
Recently shipped
What our four pillars look like when they're actually solving something.
24/7 multilingual sales conversations on WhatsApp. Vision-enabled to read ring sketches and certificate photos. Books showroom visits, qualifies leads, hands off hot ones to humans.
Stack
Impact
3× lead-to-booking conversion
First 90 days, with zero added headcount

Guesty bookings, channel data, and owner statements pulled hourly into BigQuery. Real RevPAR, real channel mix, real margin — surfaced in Looker Studio for ops and owners.
Stack
Impact
18 hours/week of manual reporting eliminated
Across 65 luxury short-term rentals

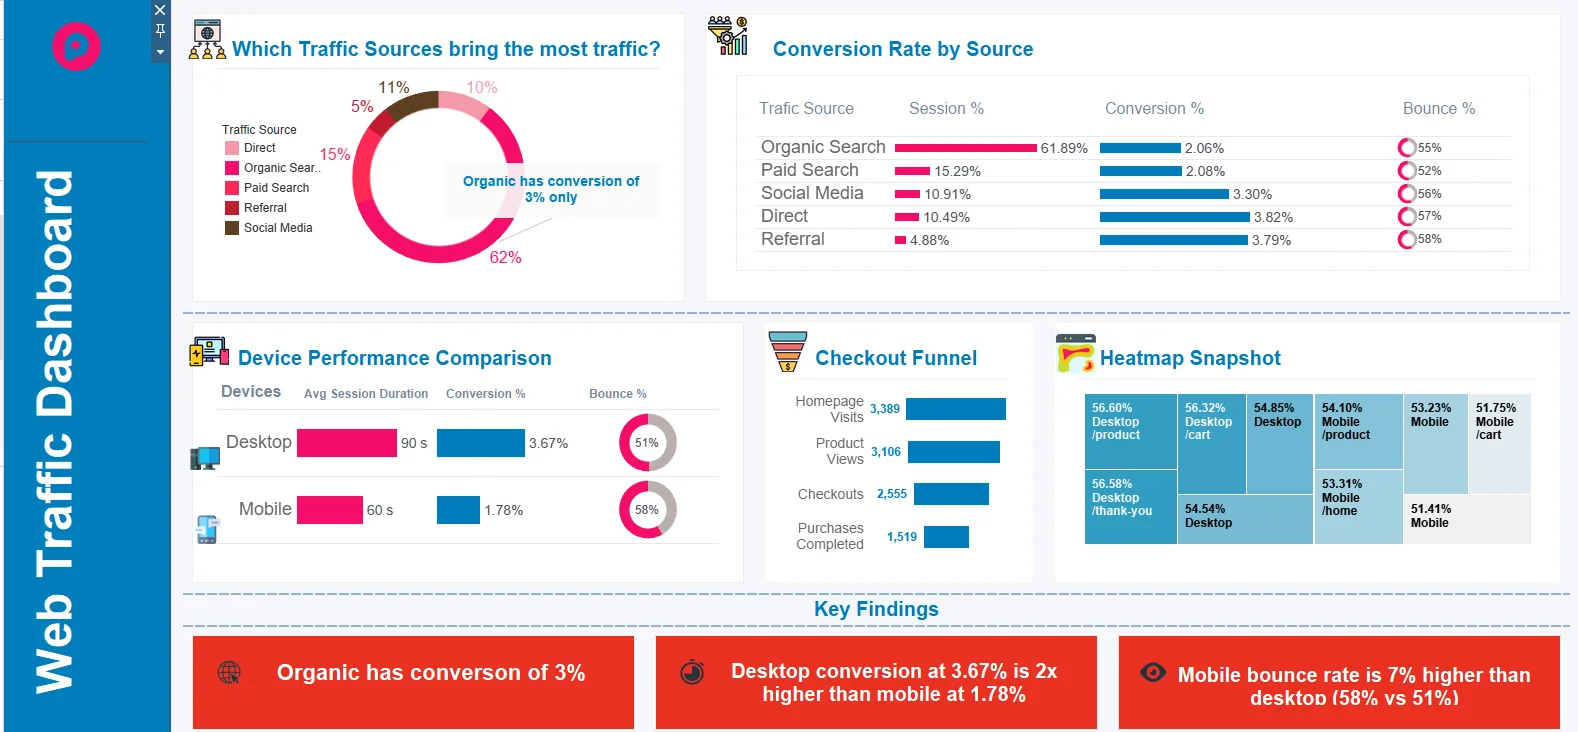
Shopify, Meta Ads, and ShipStation unified into BigQuery. Order-level contribution margin model. Budget reallocation moved from quarterly to weekly.
Stack
Impact
22% ROAS improvement in 60 days
From reallocation enabled by accurate margin data

Five years, hundreds of clients, one consistent rating. See the receipts on Fiverr.
"Payroll went from three days to fifteen minutes. VisualizExpert built a Make.com + Power BI pipeline that reads 80+ field timecards weekly with 99% accuracy."
James Mitchell
Director of Operations, Tunista Construction
"Sixty-five luxury properties, one source of truth. Guesty to BigQuery to Looker Studio — we finally have daily RevPAR instead of week-old guesses."
Elena Vargas
VP Operations, Stay Awhile Villas
"True CAC and contribution margin across Shopify, Meta, and ShipStation. We reallocated budget weekly and saw a 22% ROAS lift in sixty days."
Marcus Chen
Head of Growth, Coldral
"Automated our Power BI reporting. Saved 20+ hours weekly. The ROI was immediate — exactly what we needed on Fiverr."
Dscisney
Power BI Dashboard · Fiverr
"Best Looker Studio expert we've worked with. Clear communication, fast delivery, and dashboards our marketing team actually uses every day."
Mark
Looker Studio Project · Fiverr
"Flawless API integrations across our stack. Our data is finally accurate and our Tableau dashboards update without anyone touching a spreadsheet."
Michael
API Integration · Fiverr
Fifteen years. Thousands of builds. Real outcomes, not vanity metrics.
Years of Analytics Experience
Clients Across Industries
Projects Delivered
Customer Satisfaction
Manual Reporting Hours Eliminated
Revenue Increased for Clients
Three reasons our work outlasts the trend — and our clients keep coming back.
Reason 01
Days, not quarters
Lean team. Agile process. AI-assisted development. First working draft in 5–7 days, full system live in weeks — not the 3-month timeline traditional firms quote.
⚡ 5–7 days to first working draft
Reason 02
Premium work, fair pricing
No partner overhead. No 40% agency margins. You pay for the builder, not the brand. Predictable fixed pricing — no surprise invoices, no scope-creep games.
💰 40–60% lower than enterprise consultancies
Reason 03
Tomorrow's stack, today
We don't just use AI — we ship it. Claude, GPT-4, Gemini, vision models, agentic workflows. Production AI agents running for real clients, not just demoed in slides.
🧠 50+ AI agents live in production
The three-phase system we use to take clients from messy data to autonomous operations.
The foundation
Before a single line of code, we map your tech stack, identify data silos, and design the exact schema and workflow logic. Deliverable: a system architecture doc so you know what you’re getting before we start.
The engineering
The heavy lifting — Python ETL, API integration, Make.com/n8n workflows, AI agent deployment. We build robust, scalable pipelines that eliminate manual work and create a single source of truth.
Insights + Kaizen
With clean data flowing automatically, we ship executive reporting dashboards and hand over documentation. Kaizen kicks in — continuous monitoring, tuning, and drift detection so systems get smarter over time.
The VisualizExpert way
Listen first. Build right. Improve forever.
Wherever data, ops, and customer experience meet — we've shipped systems that work.
5.0 ★
Client Rating
4 Regions
Americas · EMEA · APAC · MEA
A peek at the work — built for marketing, finance, ops, and leadership teams across 300+ projects.
Honest answers about timelines, tools, and how we work — across data, automation, and AI.
VisualizExpert helps teams in the US, UK, Canada, and Australia ship production-grade data systems — BI dashboards (Power BI, Tableau, Looker Studio), data pipelines (BigQuery, Supabase), automations (Make.com, n8n, Python), and AI agents (Claude, GPT-4, WhatsApp, Telegram). Backed by 1000+ Fiverr reviews. Typical first draft: 5–7 business days.
Dashboards: 7–14 days. Data pipelines: 2–4 weeks. Automation flows: 5–10 days. AI agents: 3–6 weeks depending on complexity. We share a first working draft within the first week so you can course-correct early.
Four things, wired to work together: BI dashboards, data pipelines, workflow automation, and AI agents. Most clients start with one and add the others as they see what’s possible.
Power BI, Tableau, Looker Studio, BigQuery, Supabase, ClickHouse, Make.com, n8n (self-hosted on VPS), Python, Claude, GPT-4, Gemini, WhatsApp Cloud API, Wati, Telegram, Shopify, Amazon SP-API, HubSpot, Salesforce, Pipedrive. We pick the right tool for the problem — not the other way around.
Yes. Shopify, Meta Ads, Google Ads, HubSpot, QuickBooks, Guesty, custom databases, webhooks, internal tools — we unify them into a single reporting layer or warehouse so the numbers finally agree.
Both. We’ve shipped WhatsApp sales agents with vision, Telegram concierge bots, document-intelligence pipelines, and autonomous workflows in n8n. AI is one of our four pillars — not a side project.
Yes. Every system ships with documentation, a walkthrough video, and a training session. No black boxes. No vendor lock-in. You can take it in-house tomorrow if you need to.
Yes — we call it Kaizen. Monthly reviews, continuous improvements, and adjustments as your business and data evolve. Most clients stay with us past the first build.
A 30-minute discovery call, a rough idea of the problem, and access to a sample of your data (or read-only credentials). We confirm scope and share a first draft within 5–7 business days.
Tell us about your data and reporting setup. We'll review it and reply within one business day with clear next steps — no commitment required.
One email. Real humans. No ticket queue.
Your direct line
info@visualizexpert.comTell us what you're stuck on — dashboards, pipelines, automations, or AI. We reply within one business day.