Analytics & Reporting
Real-time insights with KPI scorecards, drilldowns & alerts.
What You Get
KPI Scorecards
Top-line KPIs for execs with drillthrough to teams.
Automated Reports
Scheduled PDFs, CSVs, emails/Slack for key audiences.
Anomaly Alerts
Thresholds & percent deltas to catch issues early.
Self-Serve Filters
Responsive slicers, bookmarks, and guided navigation.
Data Governance
RLS, certified datasets, and versioned definitions.
Performance
Aggregations, incremental refresh, and fast load UX.
Use Cases
- Marketing: ROAS, CAC/LTV, funnel conversion, SEO performance
- Sales: pipeline health, forecast, win/loss, coverage
- Finance: P&L, cash flow, BvA variance
- Operations: OTIF, utilization, inventory turns
Tools
Power BI • Tableau • Looker Studio • Excel/Sheets • BigQuery • Snowflake • SQL Server
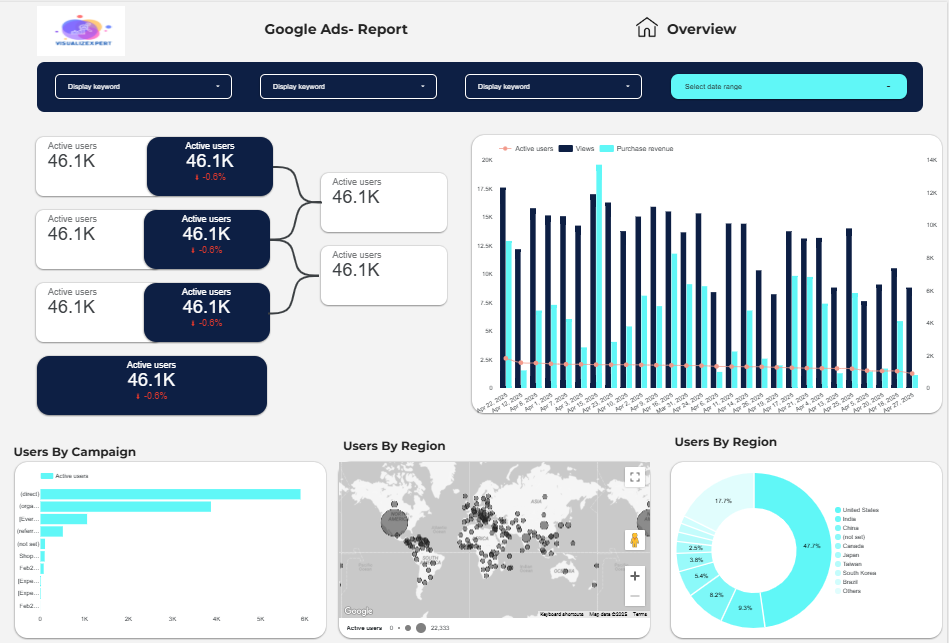
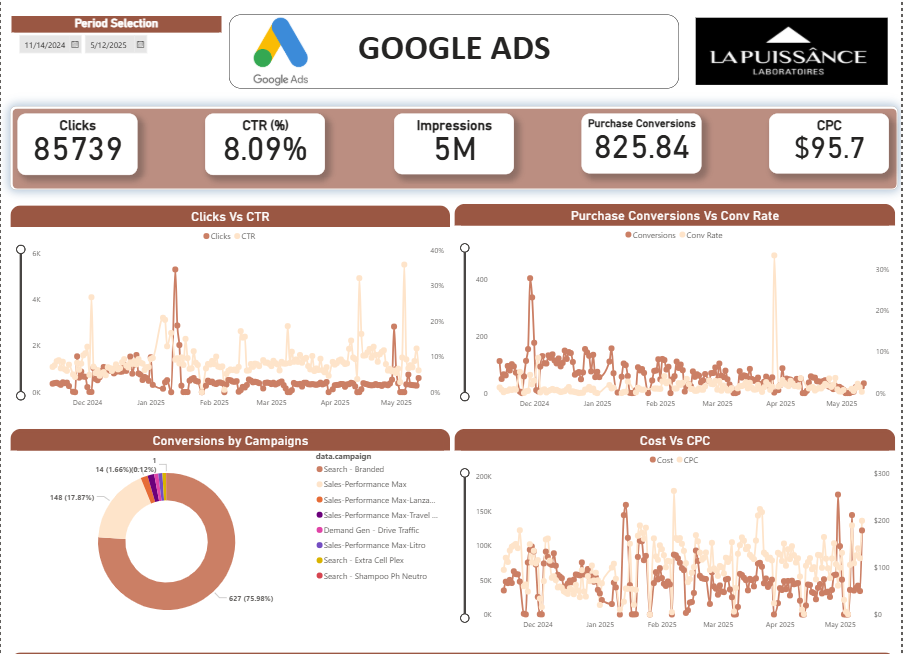
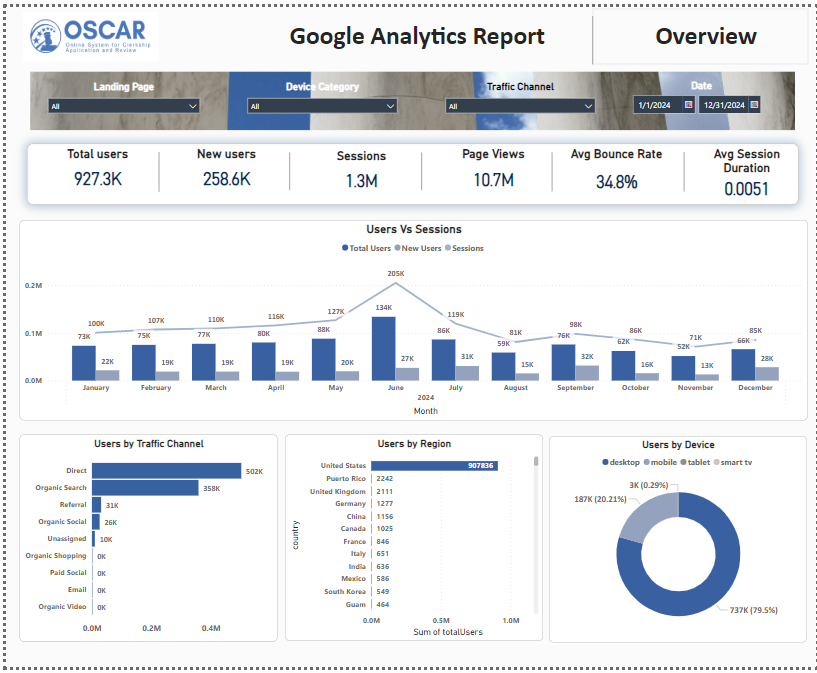
Sample Reports
Real layouts from exec to team views.
Analytics FAQs
Do you build custom reports?
Yes—tailored to your KPIs, audience, and tool of choice.
Can reports be scheduled?
Absolutely—emails, Slack, or storage with attachments.
Which BI tools do you support?
Power BI, Tableau, Looker Studio, plus Excel/Sheets.
How do we ensure adoption?
Design systems, stakeholder workshops, and training.
Get in touch
Tell us about your data needs. We’ll reply within one business day.