
The Business Challenge
Our client operates a portfolio of 65 luxury short-term rentals across Latin America and Europe. Bookings arrive from Airbnb, Vrbo, Booking.com, direct website, and a handful of concierge partners — all funneled through Guesty as their PMS.
The problem: Guesty is great for operations, but its native reporting is not. To answer basic executive questions — “What was our real RevPAR by market last month, net of channel fees and cleaning costs?” — the ops team was exporting CSVs from Guesty, exports from each channel manager, cleaning statements from property owners, and stitching them together in Google Sheets. Every Monday. For 18 hours.
Owners also wanted transparency. Each of the 65 property owners deserved a live view of their unit’s performance — not a PDF that arrived a month late.
Key Pain Points Identified
- Weekly manual close: 18 hours per week combining Guesty exports, channel fee statements, and cleaning invoices in Google Sheets.
- No true RevPAR: Gross booking revenue is easy. Net-of-fees, net-of-cleaning, net-of-owner-split RevPAR required manual math per property, per month.
- Channel mix invisibility: Which channel actually drove the most profit — not the most bookings — per property?
- Owner reporting lag: Owners got PDFs 30–45 days after month end. Trust erosion by month three.
The VisualizExpert Solution
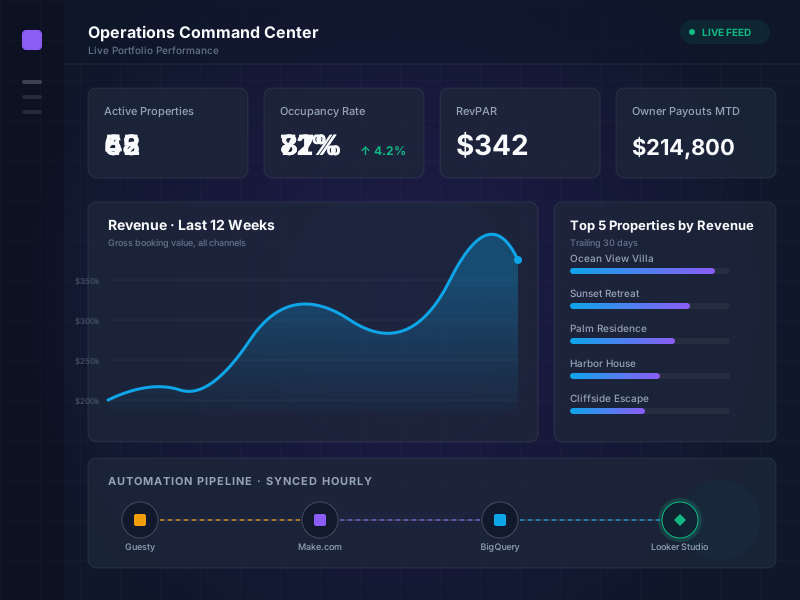
We built an hourly ETL pipeline pulling Guesty, channel APIs, and Xero into BigQuery — then surfaced two Looker Studio dashboards: one for internal ops, one white-labelled for property owners.
Our Technical Approach & Architecture
1. Ingestion via Guesty & Channel APIs
Make.com scenarios run hourly, hitting Guesty’s REST API for new/updated reservations, listings, occupancy, and financials. Separately, we pull channel-side data (Airbnb payouts, Booking.com commission statements, Vrbo net-of-fee amounts) via a mix of official APIs and structured email parsing where APIs don’t exist.
2. BigQuery as Single Source of Truth
Raw pulls land in a raw_* dataset. Scheduled SQL transformations (via Dataform) reconcile bookings to payouts, allocate cleaning and management fees per property, and compute true net margin per stay. The result is a clean reservations_enriched table where every row has: gross revenue, channel fees, cleaning cost, owner split, VE management fee, and true net contribution.
reservations_enriched (
reservation_id, property_id, channel, check_in, nights,
gross_revenue, channel_fee, cleaning_cost, owner_split, net_margin
)
3. Two Looker Studio Dashboards
The Ops dashboard shows portfolio-level KPIs: portfolio RevPAR, occupancy heatmap by market, channel mix waterfall, property leaderboard, forward pacing 90 days out.
The Owner dashboard is filtered by owner_id via URL parameter — each owner has a private link showing only their properties: this month vs. last month, YoY, upcoming bookings, and a fully itemized statement of gross, fees, and net payout.
4. Reconciliation Alerts
When a channel payout arrives that doesn’t reconcile to expected revenue (missing cleaning fee, incorrect commission), a Slack alert fires with a link to the exact reservation. Discrepancies that used to be caught monthly — if at all — now surface within 24 hours.
The Dashboard Features
- Portfolio RevPAR & Occupancy: Live view across all 65 properties with drill-down by market, property type, and season.
- Channel Profitability, Not Volume: A ranked view of which channels drive net margin, not just gross bookings.
- Forward Pacing: 30/60/90-day booked revenue vs. last year, per property and portfolio.
- Owner Portal: White-labelled Looker Studio views with URL-parameter security for each of the 65 owners.
- Reconciliation Alerts: Slack notifications when channel payouts don’t match expected revenue.
Results & Business Impact
The weekly 18-hour Monday reporting session is gone. Ops now spend that time on revenue optimization — adjusting pricing, targeting weak markets, negotiating with underperforming channels — because the data shows up on its own.
Owner retention improved measurably in the quarter after launch. Owners with live dashboards renewed at 94% vs. the historical 76% — because visibility builds trust, and trust extends contracts.
Summary of Wins
Running a Portfolio of Properties?
Whether you’re on Guesty, Hostaway, or a custom PMS — if your reporting still runs through spreadsheets, we can compress it into a live data warehouse and give both your ops team and your owners the transparency they actually need.