The Challenge: Metric Fragmentation
The CEO of a global SaaS company had a visibility problem. Sales reported "Bookings," Finance reported "Recognized Revenue," and Product reported "Active Users"—but none of the numbers talked to each other. Executive meetings were spent arguing over whose data was correct rather than making strategic decisions.
The Conflict
- Disparate Systems: Data was trapped in Salesforce, NetSuite, and Mixpanel.
- Manual Prep: Analysts spent 3 days per week manually building the "Executive Slide Deck."
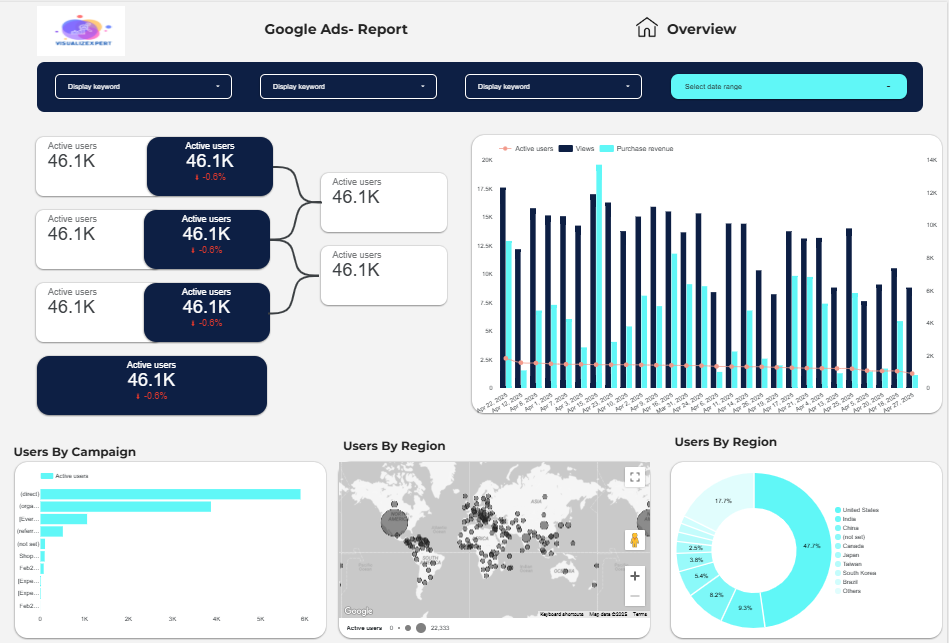
The Solution: The Single Source of Truth
VisualizExpert architected a cross-functional dashboard using Snowflake and Power BI to create a unified data layer.
1. Unified KPI Library
We created a "Master Glossary" where every metric was mathematically defined and locked down using Row-Level Security (RLS) to ensure consistency across regions.
2. North Star Tracking
The dashboard focuses on Net Dollar Retention (NDR) and LTV/CAC ratios, updating every 4 hours instead of once a month.
Results
The company reduced executive reporting prep time by 90% and identified churn risks 30 days earlier, resulting in a 12% increase in retention.