
The Business Challenge
Coldral is a fast-growing DTC brand selling premium physical goods across Shopify. Growth was healthy on the surface — Meta Ads Manager showed strong ROAS, Shopify showed rising order volume, the founder was reinvesting aggressively into paid social.
Then contribution margin started to slip. Not gross margin — that was fine. But true unit economics, once you deducted actual ad spend attributed to each order, shipping costs, payment processing, and returns — that was going the wrong direction, and nobody knew which SKU or campaign was pulling it down.
The head of growth was flying blind. Meta Ads Manager reported a 3.4 blended ROAS. But when he manually reconciled ad spend against Shopify orders in a Google Sheet once a quarter, the picture was very different — and by then, three months of budget had already been misallocated.
Key Pain Points Identified
- ROAS lies: Meta’s in-platform ROAS included view-through conversions and last-click attribution — not real incremental revenue.
- No order-level margin: Nobody knew which SKUs were actually profitable after ad spend, shipping, and returns.
- Quarterly, not weekly, decisions: Ad budget was being set once a quarter with stale data — a 90-day lag in a market that moves weekly.
- Return rate blindspot: Returns were tracked in Shopify but not deducted from “profitable” SKU calculations.
The VisualizExpert Solution
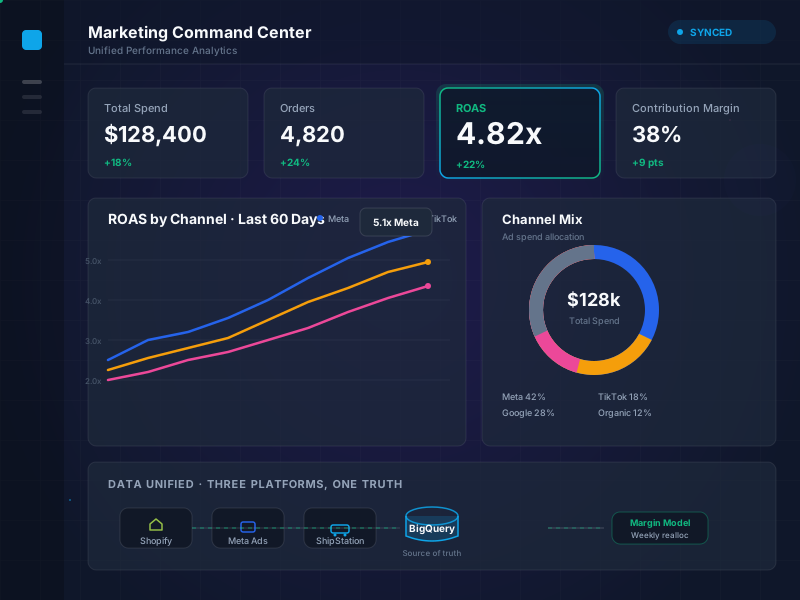
We built a unified data warehouse joining Shopify orders, Meta Ads spend, and ShipStation logistics — then layered an order-level contribution margin model that surfaces true SKU and campaign profitability weekly.
Our Technical Approach & Architecture
1. Multi-Source Ingestion into BigQuery
We pulled Shopify orders, line items, refunds, and inventory via the Admin API. Meta Ads spend (campaign, adset, ad level) came in via the Marketing API. ShipStation shipping costs and delivery timing came in via their REST endpoint. All three land in a raw_ dataset in BigQuery on a nightly schedule, orchestrated by a lightweight Python service.
2. Order-Level Contribution Margin Model
The core piece is a SQL model in BigQuery that joins every Shopify order to its attributed Meta campaign (via UTM parameters and Meta’s conversion API), computes actual shipping cost per order, allocates fulfillment and payment processing fees, and subtracts refunds. The result is a single orders_margin table where every row has the truth: gross revenue, product COGS, ad cost attributed, shipping, processing, returns — and true net contribution.
orders_margin (
order_id, sku, channel, campaign_id,
gross_revenue, cogs, ad_cost, shipping_cost,
processing_fee, refund_amount, net_contribution
)
3. Weekly ROAS Reconciliation
Every Monday, a Python job compares Meta’s reported ROAS to our BigQuery-computed true ROAS per campaign. Deltas above 15% trigger a Slack alert with a link to the specific ad set — giving the growth team a weekly cadence to pause underperformers and double down on the real winners.
4. Executive Dashboard in Looker Studio
The head of growth and the founder open one dashboard every Monday morning. Contribution margin by SKU, true ROAS by campaign, top 10 profitable products this week, bottom 10 to prune, ad spend recommendations for the coming week. All backed by the underlying warehouse — no more Google Sheet reconciliation.
The Dashboard Features
- True vs. Reported ROAS: Side-by-side view of Meta’s in-platform ROAS and our warehouse-computed true ROAS per campaign.
- SKU Contribution Ranking: Every SKU ranked by net contribution margin — not gross revenue.
- Campaign Prune List: Auto-generated list of ad sets with negative true contribution over the past 14 days.
- Weekly Budget Recommendation: Suggested reallocation based on rolling 14-day performance.
- Return Rate Overlay: Return rate applied to every SKU margin calculation — no more hiding refunds in a footnote.
Results & Business Impact
Within 60 days of the dashboard going live, blended ROAS improved 22%. Not because of any new creative or targeting change — but because the growth team stopped funding campaigns and SKUs that looked profitable in Meta and had been quietly draining margin.
Budget cycles moved from quarterly to weekly. The head of growth now runs a 30-minute Monday review with the warehouse data, cuts what doesn’t work, and scales what does — on a 7-day feedback loop instead of a 90-day one.
Summary of Wins
Running a DTC Brand on Blind ROAS?
If your ad decisions are based on what Meta Ads Manager tells you, you’re optimizing to a number that doesn’t reflect your actual P&L. We build the warehouse that gives you the real picture — order by order, SKU by SKU, campaign by campaign.