The Crisis of Manual "Excel Glue"
A fast-growing FinTech company reached a breaking point. Their operations team was spending over 100 hours monthly acting as "human glue"—exporting CSVs from Stripe (Billing), Zendesk (Support), and HubSpot (Sales), and manually merging them into massive Excel workbooks.
The risks were significant: data was often 48 hours old, human error in VLOOKUPs led to incorrect churn reporting, and the system was completely unscalable for their projected 3x growth.
The Technical Architecture
We designed a serverless architecture to ensure high availability and low maintenance costs. The core components included:
- Python & AWS Lambda: Lightweight scripts to handle API authentication and pagination.
- JSON Normalization: Converting nested API responses into flat relational tables.
- Snowflake Data Warehouse: A central repository designed for high-concurrency analytical queries.
Building the Pipeline: Step-by-Step
1. Direct API Integration
Instead of relying on third-party connectors that often lack custom field support, we wrote native Python integrations for Stripe and HubSpot. This allowed us to pull custom metadata fields essential for their specific billing cycles.
2. Incremental Loading Logic
To keep Snowflake costs low, we implemented a "Delta Load" logic. The pipeline only fetches records modified since the last successful run (using `updated_at` timestamps), significantly reducing processing time.
3. Data Quality & Slack Alerts
We built an automated audit layer. If a record contains a null value in a critical field (like `customer_id`), the pipeline logs the error and pings the engineering team via Slack, ensuring the dashboard data is always trustworthy.
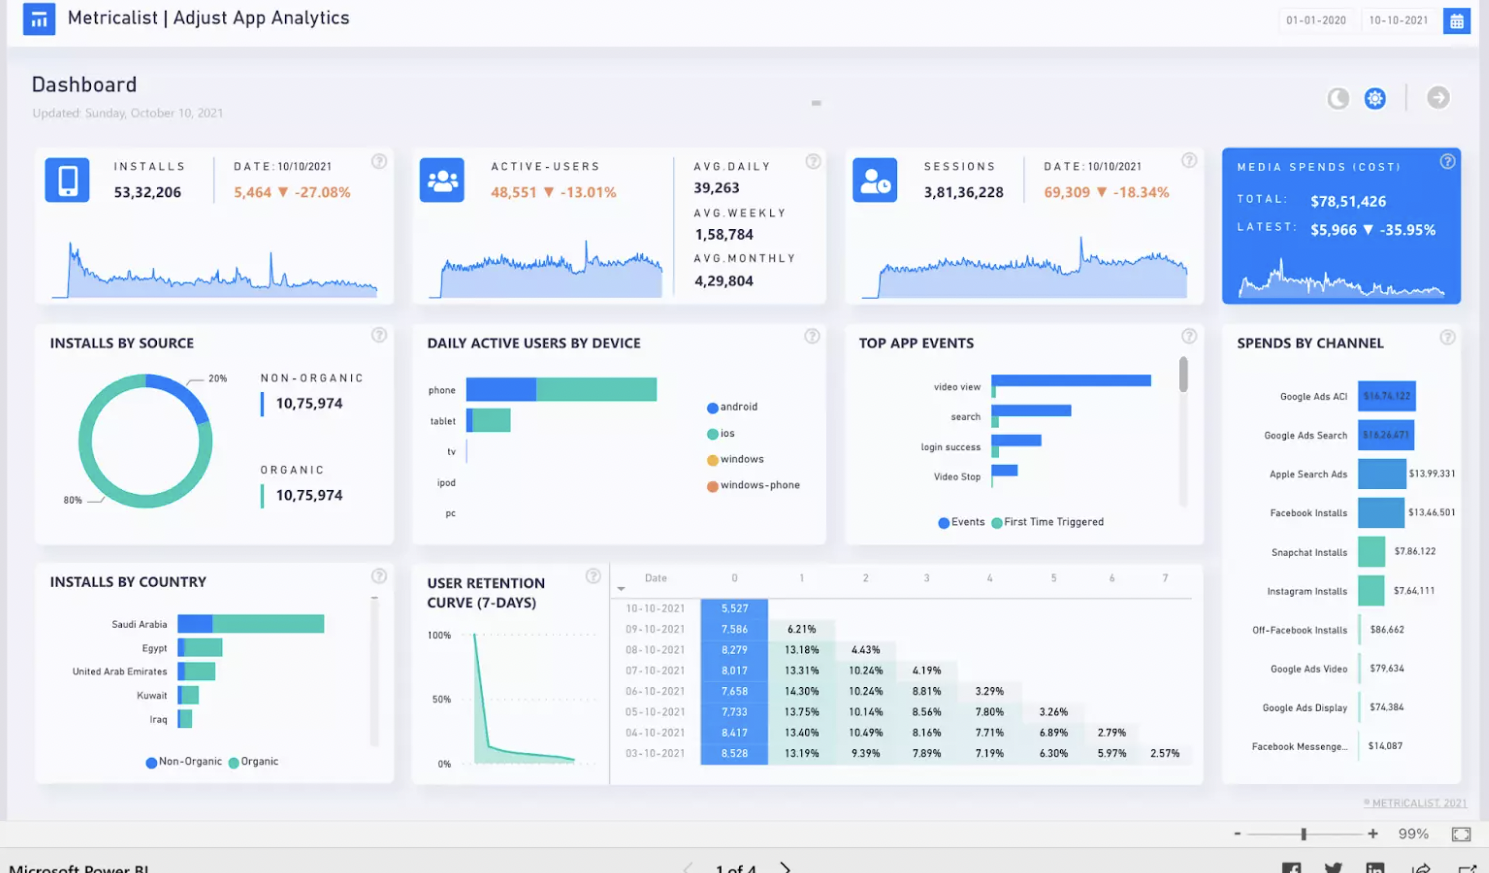
The Result: Real-Time Intelligence
The transformation was immediate. The C-suite now has access to a live dashboard where "Revenue vs. Support Load" is visualized in real-time. Analysts have been freed from the "CSV trap" and now spend their time on strategic modeling instead of data cleaning.